
How to Prepare for Data Analyst Jobs Interviews as a Fresher
Get a 14-day preparation schedule and word-for-word scripts to explain your projects, while mastering the SQL concepts that make up 40% to 50% of your technical score.
To prepare for a fresher data analyst interview in India, spend your time mastering SQL joins and window functions, Advanced Excel, a 2-minute business narrative for your top two projects, and basic pandas data cleaning. According to HireStepX's 2026 findings, SQL alone accounts for 40% to 50% of the technical evaluation weight in Indian entry-level interviews and acts as the primary elimination filter.
By the end of this guide, you will have a day-by-day 14-day preparation schedule, exact SQL and Python concepts to practice, and word-for-word scripts to explain your dashboard projects and HR answers with confidence.
Key takeaways
- Prioritize SQL above all else: Multi-table JOINs,
WHEREvsHAVING, Common Table Expressions (CTEs), and window functions (ROW_NUMBER(),RANK(),DENSE_RANK()) make up up to half of your technical score. - Keep Python focused on data wrangling: Skip complex machine learning algorithms and practice cleaning columns, handling missing values (
fillna,dropna), and merging datasets inpandas. - Use a 2-minute project script: Interviewers reject copied Kaggle notebooks when you cannot explain missing-value logic, dataset row counts, or actionable business impact.
- Tailor your prep to the employer type: Product startups in Bengaluru or Gurugram pay 40% to 60% more and test live Python/SQL and open-ended guesstimates, while IT services and captive hubs focus heavily on Excel, Power BI, and SQL.
How does the fresher data analyst interview process work in India?
According to 2026 placement analyses from WhiteScholars and TechPanda, a typical fresher data analyst interview in India spans 3 to 5 rounds: an online SQL and aptitude test, one or two live technical rounds, a business case or guesstimate round, and an HR conversation. However, your exact experience and compensation will depend heavily on the type of company calling you.
Fresher salaries for data analyst jobs vary by company tier and location, so check current listings on Naukri or LinkedIn before quoting expectations. General job boards reported by PlacementPreparation.io and Skillset Master in 2026 place entry-level baselines around ₹3.5 LPA, whereas specialized tech blogs and product placement reports position tier-1 fresher offers between ₹5 LPA and ₹7 LPA. According to 2026 data from The InGrade and Skillset Master, product companies and fintech startups in Bengaluru, Gurugram, and Mumbai pay freshers 40% to 60% higher packages than traditional IT services firms.
| Company Type | Typical Process | Core Tools Tested | Primary Focus Area |
|---|---|---|---|
| Traditional IT Services, Captive Centers & MIS Roles (e.g., Delhi-NCR/Mumbai roles) | Multi-tier funnels (online test, two technical rounds, case study, HR) | Advanced Excel, SQL, Power BI | Fixed-format reporting, XLOOKUP, PivotTables, Star Schemas |
| Product Startups & Tech Firms (e.g., Bengaluru, Hyderabad, Gurugram tech hubs) | Live SQL coding round and a combined manager/HR interview (some startups bypass online screening) | SQL, Python (pandas), BI Tools | Live query writing, messy data wrangling, product guesstimates |
Know whether you are interviewing for a product startup or an IT service firm before you start revising.
Your 14-day study schedule for data analyst interviews
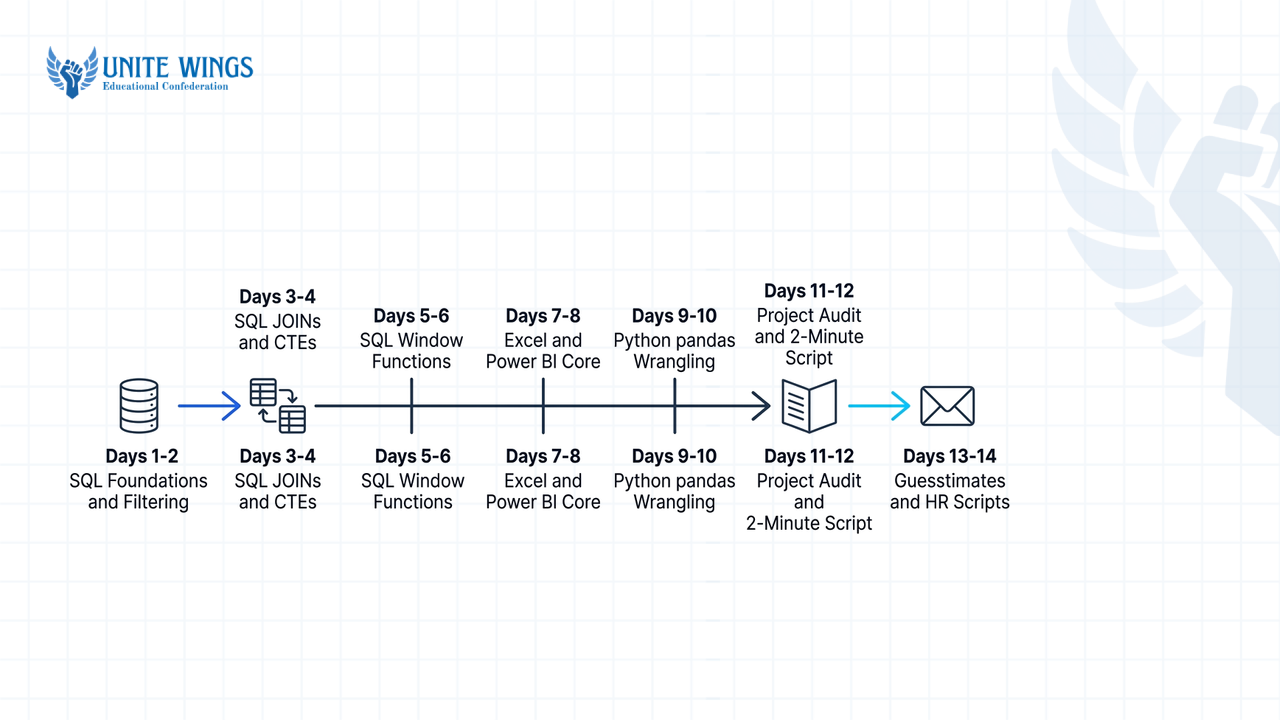
If you have a campus placement drive or an off-campus interview call in two weeks, you can compress the standard three-week preparation cycle into a high-output 14-day sprint. According to Evika Academy and Sparc.org.in (2026), Indian entry-level assessments rigorously check SQL, Excel, and Power BI, so your preparation must focus heavily on these technical tools.
- Days 1–2 (SQL Foundations & Filtering): Practice
SELECT,WHEREvsHAVING,GROUP BY,ORDER BY, and aggregate functions (SUM,COUNT,AVG) on HackerRank or LeetCode. Write every query with explicit column aliases. - Days 3–4 (SQL JOINs & CTEs): Master
INNER,LEFT,RIGHT, andFULL OUTERjoins across three-table schemas. Replace deeply nested subqueries with Common Table Expressions (WITHclauses) for readability. - Days 5–6 (SQL Window Functions): Solve at least 15 "top N per group" problems using
ROW_NUMBER(),RANK(),DENSE_RANK(), andLEAD()/LAG()for month-over-month growth calculations. - Days 7–8 (Excel & Power BI Core): Practice
XLOOKUP,VLOOKUP, PivotTables, and Power Query automation in Excel. In Power BI, review star schemas (fact vs dimension tables) and basic DAX measures (CALCULATE,SUMX). - Days 9–10 (Python
pandasWrangling): Practice reading CSVs, identifying duplicate rows, handling missing values withfillna()anddropna(), merging DataFrames, and runninggroupby()aggregations. - Days 11–12 (Project Audit & 2-Minute Script): Pick your top 2 or 3 portfolio projects. Memorize the exact row count, column schema, missing-value percentage, and business recommendation for each.
- Days 13–14 (Guesstimates, HR Scripts & Mock Screen-Share): Practice 4 top-down and bottom-up guesstimates out loud. Run a 30-minute timed SQL coding session in Notepad or a basic browser editor without syntax autocomplete.
Spend the first six days exclusively on SQL and Excel before touching case studies or behavioral prep.
What are the most asked SQL questions in fresher data analyst interviews?
According to 2026 interview guides from Evika Academy, Vercel, and HireStepX, the most asked SQL questions for freshers test multi-table JOINs, the exact difference between WHERE and HAVING, Common Table Expressions (CTEs), and window functions like ROW_NUMBER(), RANK(), and DENSE_RANK() on live coding platforms.
During live shared-screen coding rounds, many freshers panic when syntax autocomplete is disabled or a 30-minute timer starts ticking. According to WhiteScholars (2026), when you face an unfamiliar SQL problem, you should immediately voice your logic and state your assumptions about table joins or duplicate keys before typing code, rather than staying silent or inventing fake syntax.
Prepare for these three guaranteed SQL question patterns:
WHEREvsHAVINGfilter logic: According to Vercel and SkillUp Academy (2026),WHEREfilters individual rows before any grouping occurs, whereasHAVINGfilters aggregated groups afterGROUP BYhas been applied. If an interviewer asks you to find product categories with total sales above ₹50,000 excluding returned items, you useWHERE status != 'Returned'first, thenGROUP BY category, and finallyHAVING SUM(sales) > 50000.ROW_NUMBER()vsRANK()vsDENSE_RANK(): According to Evika Academy (2026), interviewers use these window functions to separate junior candidates on "top N per category" questions. If two employees tie for the highest salary in a department:ROW_NUMBER()assigns unique sequential numbers (1, 2, 3) arbitrarily breaking the tie.RANK()assigns the same rank to ties and skips the next number (1, 1, 3).DENSE_RANK()assigns the same rank to ties without skipping the next number (1, 1, 2).
- Self-Joins and Left Anti-Joins: Expect questions like "Find customers who placed an order in January 2026 but not in February 2026" (solved via a
LEFT JOINwhere the right table's keyIS NULL) or "Find employees who earn more than their direct managers" (solved via a self-join on the employee table).
Always use DENSE_RANK() inside a CTE when an interviewer asks for the second-highest or top three values per group without skipping tied ranks.
Do Indian recruiters ask Python coding questions to fresher data analysts?
Yes, Indian recruiters test Python, but according to 2026 reports from Skillovilla, Evika Academy, and MyCareerNet, expectations for fresher data analysts focus strictly on data wrangling and manipulation using pandas and NumPy, not software engineering algorithms or deep machine learning.
You do not need to grind binary trees or dynamic programming for data analyst jobs. According to a 2026 guide by Skillsetmaster, a standard screening task involves cleaning a 100,000+ row dataset that has 5% duplicate rows, handling missing values, and generating grouped summary tables.
Make sure you can write and explain these exact pandas operations from memory:
import pandas as pd

# 1. Load dataset and check initial shape
df = pd.read_csv('sales_transactions_2026.csv')

# 2. Remove exact duplicate rows (e.g., 5% duplicates)
df = df.drop_duplicates(subset=['transaction_id'], keep='first')

# 3. Handle missing values: median for skewed numeric, drop if key is missing
df['order_amount'] = df['order_amount'].fillna(df['order_amount'].median())
df = df.dropna(subset=['customer_id'])

# 4. Merge with customer master table and aggregate by region
merged_df = pd.merge(df, customers_df, on='customer_id', how='left')
regional_summary = (
    merged_df.groupby('region')['order_amount']
    .agg(total_sales='sum', avg_order='mean', order_count='count')
    .reset_index()
)
Be ready to explain why you chose fillna() with a median instead of a mean, as interviewers always ask how outliers affect your missing-value treatment.
How do I explain my college or Kaggle project in a data analyst interview?
According to NareshIT and PracHub (2026), you should explain your college or Kaggle project using a concise 2-minute problem-solving narrative that covers five points: the business problem, dataset scope, data cleaning hurdles, primary quantified insights, and actionable business recommendations.
What most students get wrong is reciting every chart they built ("First I made a bar chart, then a pie chart, then a slicer") or copying a popular Kaggle or YouTube tutorial without inspecting the raw rows. According to 2026 reports from PracHub and candidate discussions on Reddit, Indian hiring managers actively set verification traps to catch tutorial-copied projects. They will pause your pitch and ask: "How many exact rows were in your fact table? What percentage of customer IDs were null, and what was the exact denominator in your churn rate DAX measure?"
Furthermore, if you used AI assistants like ChatGPT or Claude to help write your SQL queries or DAX formulas while building the project, never pretend you wrote complex syntax unaided if you cannot explain how it works line by line. Tell the interviewer you used AI to speed up boilerplate syntax, and immediately prove ownership by explaining the underlying table grain and filtering logic. If your resume still relies on generic datasets, the AI Portfolio Sprint helps you pick a real problem, build a working project with AI support, and publish proof you can defend in technical rounds.
Word-for-word script to explain your dashboard project
Copy and adapt this 2-minute script for your technical round:
"For my primary project, I analyzed regional delivery delays and customer churn for an Indian quick-commerce dataset to identify why repeat order rates dropped in Q3.
The raw dataset contained 142,000 transaction rows across four tables: Orders, Customers, Delivery Partners, and Inventory. Before building the Power BI dashboard, I used SQL and Power Query to clean the data. I found that 4.8% of order rows had duplicate timestamps due to payment gateway retries, which I deduplicated using
ROW_NUMBER()partitioned by order ID. For the 6% missing delivery-time values, I imputed the median delivery duration grouped by pin code rather than the global average, because traffic delays were heavily skewed in metro zones.After modeling the tables into a star schema and writing DAX measures for 30-day retention, I discovered that 68% of customer churn occurred when a user's first two orders were delayed by more than 12 minutes during evening peak hours (7 PM to 9 PM).
Based on this insight, my business recommendation was to reallocate 15% of idle afternoon fleet capacity to high-density pin codes between 6:30 PM and 9:30 PM, and trigger an automated ₹50 wallet credit only when a first-time user experiences a >10-minute delay, protecting margins while cutting early churn."
Common mistake: The denominator trap
When you quote a percentage on your dashboard (such as "22% churn rate" or "18% conversion"), interviewers will immediately ask how you defined the numerator and denominator. Always verify whether you divided by total registered users or active monthly users, and be ready to state the exact date window of your dataset.
Memorize the exact row count, null-value treatment, and one quantified business recommendation for the top two projects on your resume.
What kind of guesstimate and puzzle questions are asked in analytics firms?
According to 2026 interview guides from UpGrad, Ivy Pro School, and Sanviora, analytics and product firms in India ask guesstimates such as estimating daily cab rides in Bengaluru, the number of ATMs in India, or daily cups of tea consumed in Delhi to test your structured thinking, mental math, and communication under ambiguity. Additionally, an older 2020 guide from Analytics Vidhya notes that firms occasionally ask classic logic puzzles—such as the two trains and a bird distance puzzle, or measuring exact liters using 4L and 5L water beakers—to judge raw problem-solving aptitude from scratch.
According to Sanviora and RoadToOffer (2026), you should solve every guesstimate using a 4-step framework: clarify the scope, break the problem into top-down (population-driven) or bottom-up (capacity/throughput-driven) components, state round-number assumptions, and run a final sanity check.
Here is how to walk an interviewer through "Estimate the number of daily app-based cab rides in Bengaluru":
- Clarify the scope: Ask the interviewer, "Should I include auto-rickshaws and bike taxis booked via apps, or strictly four-wheeler cabs? And are we estimating for a standard weekday?" Assume weekday four-wheeler app cabs only.
- Choose a top-down population segmentation:
- Start with Bengaluru's approximate population as a clean round number: 1.4 crore (14 million) people.
- Exclude rural outskirts and populations below age 18 or above 65 who rarely book solo app commutes (~30%), leaving ~10 million (1 crore) addressable residents.
- Segment by income and smartphone penetration: Assume 30% belong to the working mid-to-high income bracket who can afford cab fares = 3 million potential users.
- Apply frequency and occupancy assumptions:
- Divide the 3 million users into Daily Commuters (10% = 300,000) who take 1.5 rides a day (450,000 passenger trips) and Occasional Users (90% = 2.7 million) who take 1 ride every 10 days (270,000 passenger trips).
- Total daily passenger trips = 720,000 trips.
- Account for shared occupancy (average 1.5 passengers per cab ride): 720,000 / 1.5 = 480,000 cab rides per day.
- Perform a bottom-up sanity check: If Bengaluru has roughly 40,000 active app-based four-wheeler cabs running 12 trips per day across a 12-hour shift, 40,000 × 12 = 480,000 rides per day. Both numbers align.
Never do silent math on paper during a guesstimate; talk through every filter and round your numbers to the nearest multiple of 5 or 10 so you do not stumble on arithmetic.
How should I answer why I want to become a data analyst in the HR round?
According to 2026 findings from Jobprax, TechPanda, and WhiteScholars, your answer to "Why do you want to become a data analyst?" must demonstrate a genuine passion for converting messy information into clear, decision-ready commercial answers, rather than reciting a list of software tools you learned in college.
Indian recruiters reject freshers who say, "Data is the new oil and I love making charts in Power BI." While a 2026 AccioJob report notes that India generates roughly 2.5 quintillion bytes of data daily across more than 825 million internet users, companies hire you to make sense of their specific business bottlenecks. If you want structured practice framing your technical stories and handling behavioral pressure, the Interview Masterclass gives you a repeatable framework for answering any question and a live mock round to test it.
Copyable script for the HR round
Use this exact structure to link a real experience to business impact:
"I want to start my career as a data analyst because I enjoy taking ambiguous problems with messy, incomplete records and turning them into concrete decisions that save money or time.
During my final-year project, our college fest sponsorship team was cold-calling local businesses at random with a 3% conversion rate. I pulled three years of past sponsorship sheets into Excel, cleaned out duplicate contacts, and grouped sponsors by industry and ticket size. We saw that local coaching institutes and food chains accounted for 70% of closed deals when approached 45 days before the event. Shifting our outreach exclusively to those two segments doubled our sponsorship revenue in two weeks.
That experience showed me how raw data directly drives commercial results. Having built my technical foundation in SQL, Excel, and Power BI, I want to apply that same structured problem-solving to larger operational datasets on your analytics team."
Anchor your HR motivation answer to a specific moment where your analysis changed a real decision, even if it was during a college event or capstone project.
What to do next before your interview day
Do not passively read SQL syntax guides the night before your placement drive. Execute these three concrete actions right now:
- Audit your top two resume projects today: Open your SQL scripts and Power BI or Tableau files. Write down the exact number of rows, the primary key of your fact table, how you handled nulls, and one quantified recommendation on a single revision sheet.
- Run a 30-minute no-autocomplete SQL drill: Open a plain text editor alongside HackerRank or LeetCode and solve one
JOIN+HAVINGquestion and oneDENSE_RANK()window function question while speaking your logic out loud. - Record your 2-minute project pitch on your phone: Read the dashboard script from this guide adapted to your own project, play it back, and cut any sentence where you list visual chart types instead of business insights.
Practice your pitch in a live mock round
Knowing the right SQL syntax is half the battle; explaining your projects and guesstimates clearly under live questioning is what gets you the offer letter. Join the Interview Masterclass to learn a structured formula for answering technical and HR questions, and test your readiness in a live mock interview round before you face the real panel.
Frequently asked questions
Do freshers need to know advanced machine learning for data analyst interviews in India?
No, freshers do not need advanced machine learning for entry-level data analyst interviews in India. According to 2026 findings from Evika Academy and MyCareerNet, interviewers evaluate you on SQL queries, Advanced Excel, Power BI or Tableau dashboards, and Python data cleaning using pandas and NumPy, rather than predictive modeling.
How many data analyst interview rounds are typical in Indian companies?
According to 2026 placement reports from WhiteScholars and TechPanda, Indian companies typically conduct 3 to 5 interview rounds for fresher data analysts. The standard funnel starts with an online aptitude and SQL coding test, followed by one or two technical rounds, a business case or guesstimate discussion, and an HR round.
What is the difference between a Data Analyst and a Business Intelligence (BI) Analyst in interview evaluations?
In India, responsibilities between Data Analysts, Business Analysts, and BI Analysts frequently overlap, but interview evaluations tilt toward different tools. According to Sparc.org.in and TechPanda (2026), BI Analyst interviews heavily test Power BI or Tableau dashboard logic, star schemas, and DAX measures, while Data Analyst rounds emphasize SQL and Python wrangling.
How should I handle a technical SQL or case study question if I get stuck?
According to WhiteScholars (2026), if you get stuck on an unfamiliar technical or case study question, you should never panic or invent fake syntax. Instead, voice your logical thought process out loud, state your assumptions about the dataset or business model, and walk the interviewer through how you would structure the solution step by step.
Can a fresher from a non-engineering or commerce background crack a data analyst interview in India?
Yes, commerce and non-IT graduates regularly clear entry-level data analyst interviews in India, especially for MIS, captive center, and business analytics roles. By mastering SQL, Advanced Excel (XLOOKUP, PivotTables), and Power BI, and presenting 2 to 3 domain-specific portfolio projects with clear business metrics, you compete on equal footing with engineering graduates.
What is the average starting salary for a fresher data analyst in India in 2026?
According to 2026 salary tracking by PlacementPreparation.io and Skillset Master, fresher data analyst packages in India typically range from ₹3.5 LPA to ₹6 or ₹7 LPA. However, The InGrade notes that product companies and fintech startups in hubs like Bengaluru and Gurugram pay 40% to 60% more than traditional IT service firms.
Newsletter
Stay updated with our latest news and insights.